R is a programming language for statistics that is used frequently by archaeologists (the other popular option is Python). One of the advantages of scripting or writing out your analysis as a sequence of commands is that anyone can look at your code and understand what you did and why it worked.
- Launch a virtual computer running RStudio in your browser by right-clicking on this link. nb If no one has launched this virtual computer in a while, it can take several minutes to launch; but once someone else has launched it once, it’ll be faster for the rest of us.
/rstudio/ in the address bar with /tree/; the virtual computer’s file manager will display. Tick off the box beside the file you wish to save, and hit ‘download’. You can go back to rstudio by changing the URL back to /rstudio/
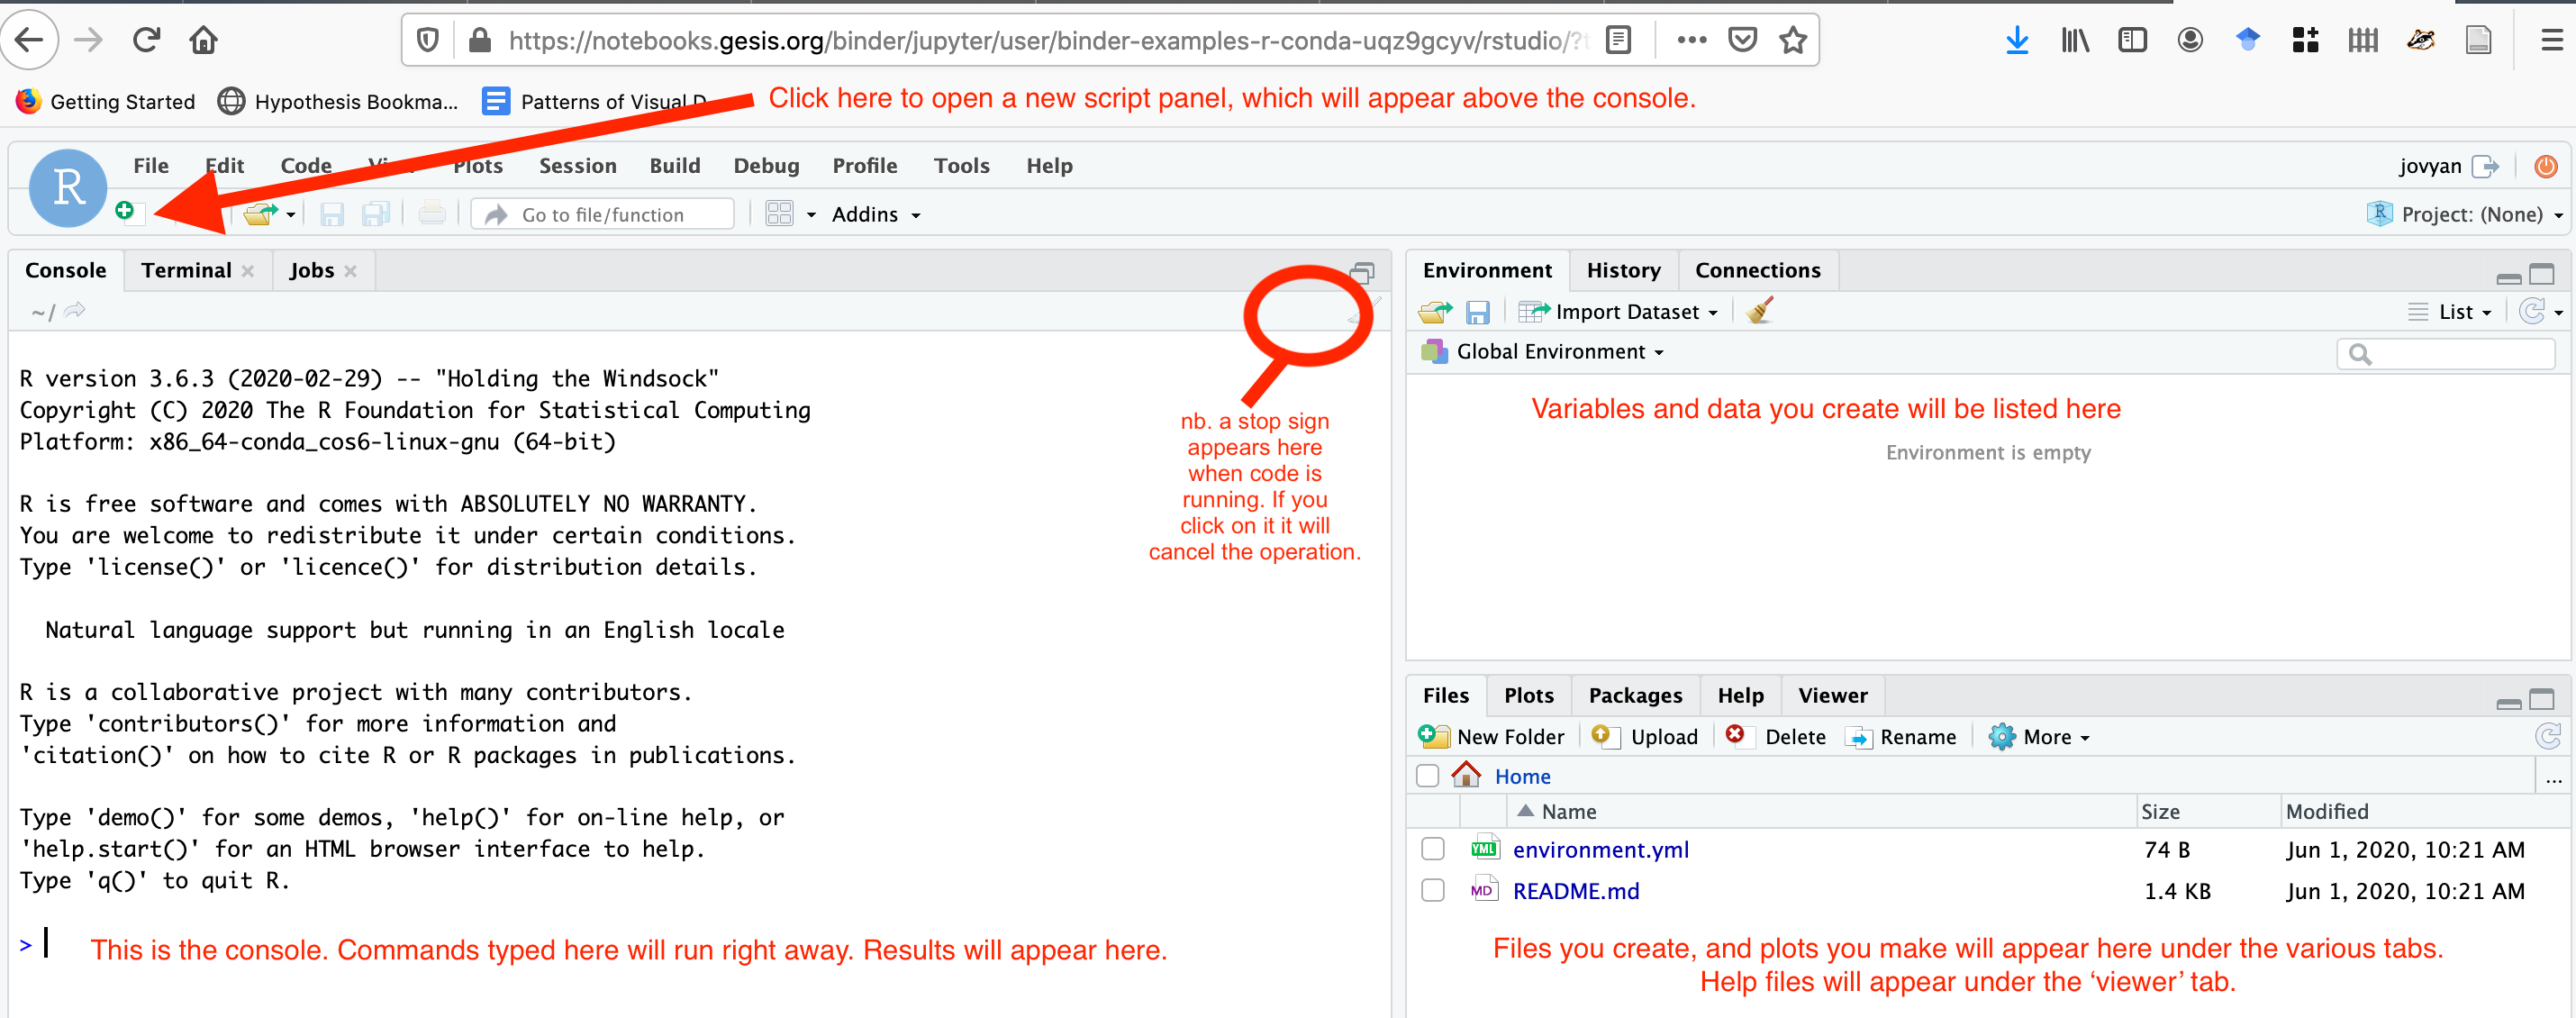
- The interface for RStudio looks like this:
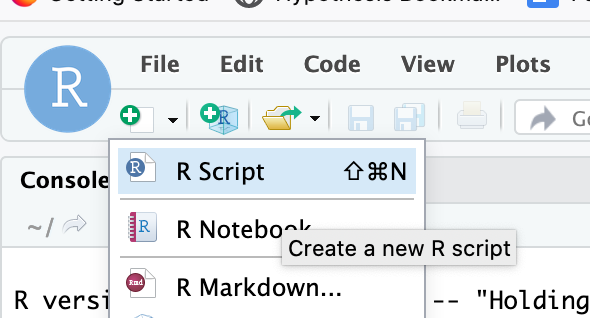
- Create a new script:
-
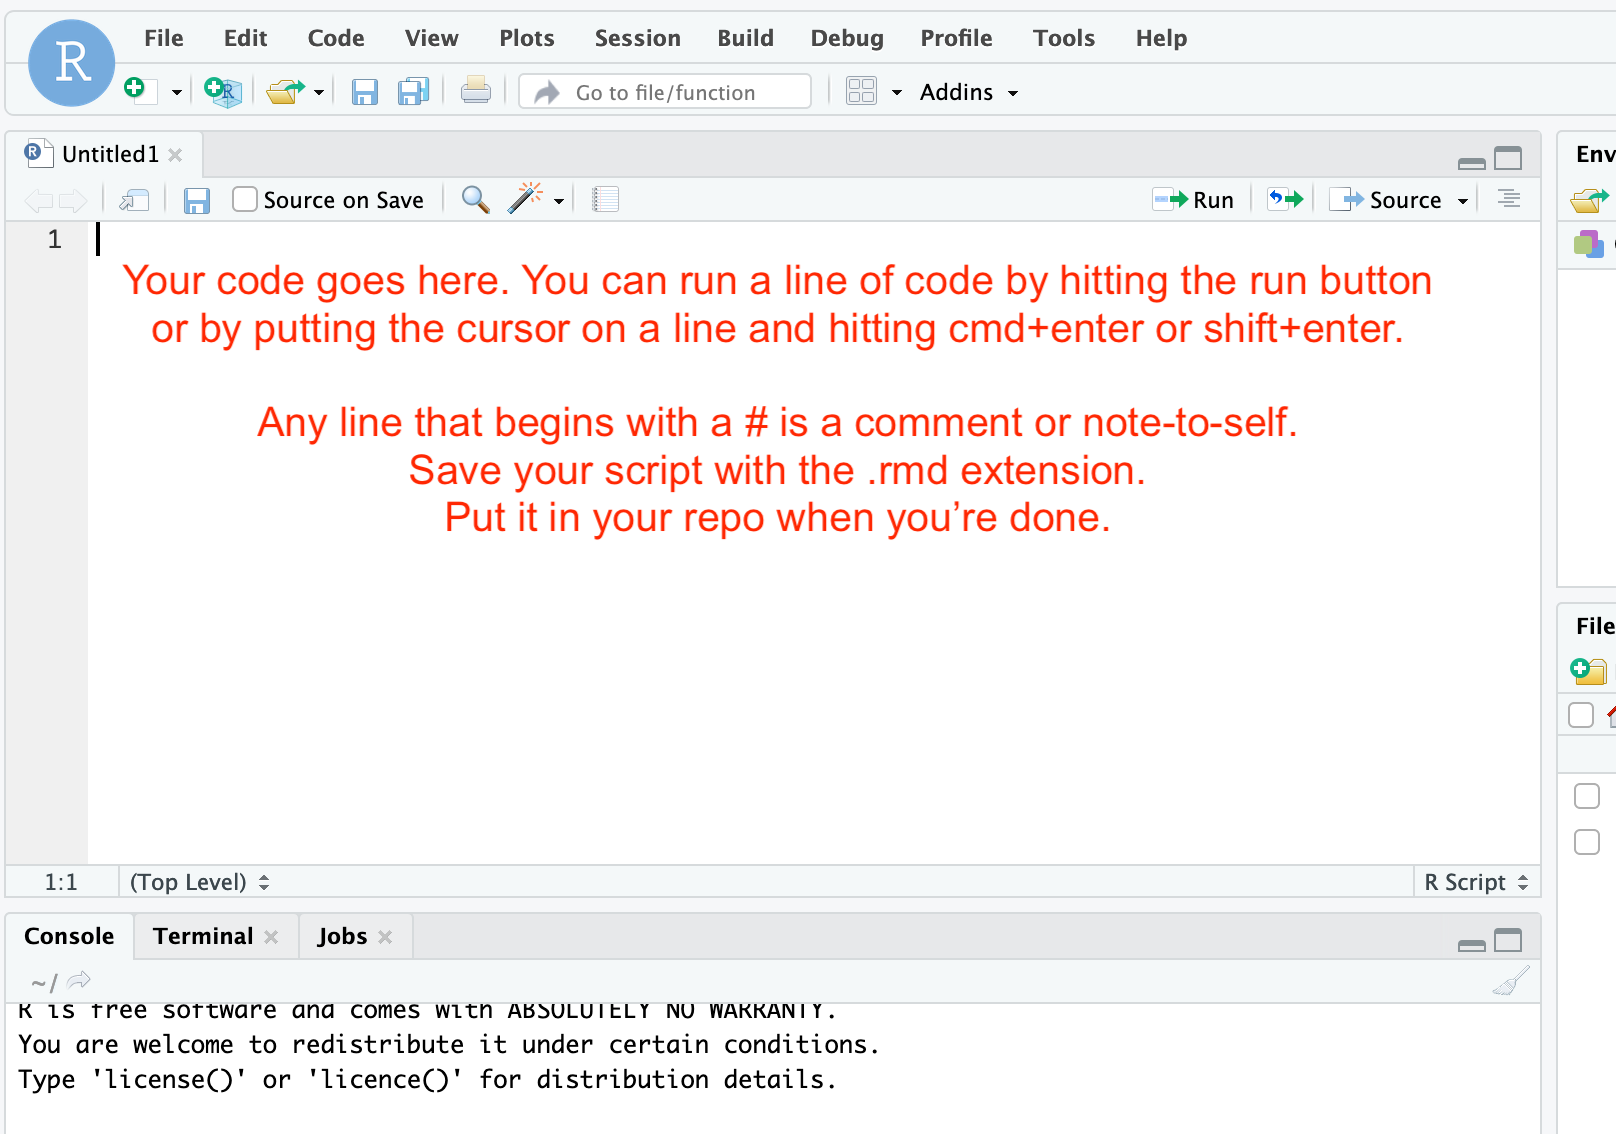
The script that you want can be found at this link. Open the link in a new tab, and then copy it into the script window in R Studio. Put the cursor at the top of the file at the start of the line. You can then run each line by hitting the ‘run’ button, or by using the keyboard shortcut (cmd+enter or shift+enter). Read the comments (which are marked with a
#sign) and follow all instructions. ATTENTION! The graveyard data file that I give you to work with - that is a .csv but because of how it was exported from our data collection system it swapped in semi-colons as field delimters (not commas)! Thus, when you go to load up the file with the code as I first wrote it, it’ll just present you with a single column of data. Not useful. The solution: tell R that the csv file uses a semicolon to separate the fields. So, instead of this
graveyards <- read.csv( curl("https://url-to-the-data.csv"))
you need to add thesepinformation:
graveyards <- read.csv( curl("https://url-to-the-data.csv"),sep=";" )
(‘url-to-the-data’: replace with the actual url in the original code!) -
Going further: Try Kevin Gartski’s tutorial on visualizing archaeological data here. You can copy and paste that code directly into a new script in R (click on the ‘raw’ button on github, then copy all the text, paste into the R script window).